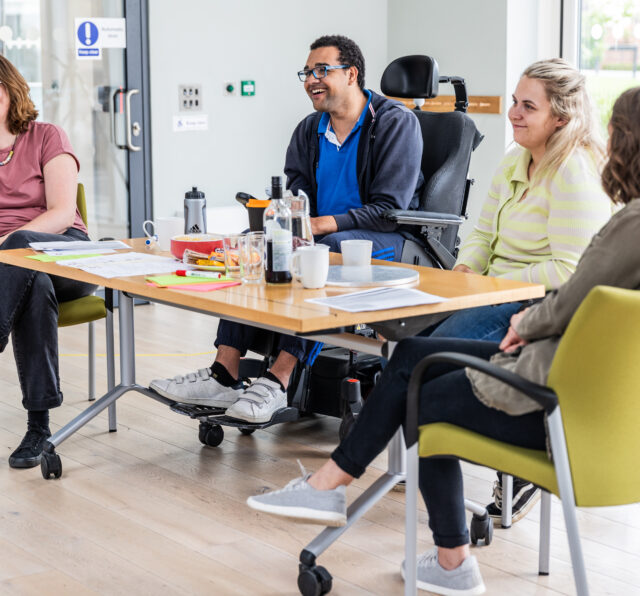
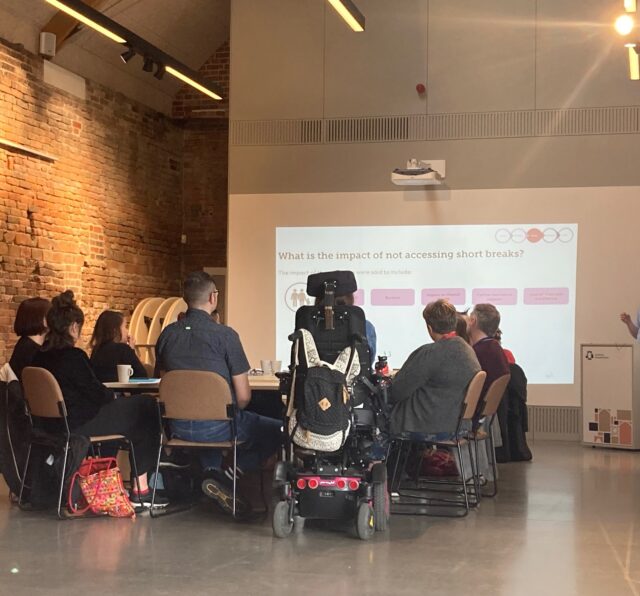
A diagram about transport. On the left of the diagram is a stat that reads '44%. Nearly half of people surveyed can't do the things they want to'. Above the stat is a hand-drawn illustration of a bus. On the right of the stat is a women in a wheelchair, enclosed within a yellow circle. Below the stat, is a row of four faces. The two bigger faces on the left are frowning while the two smaller faces on the right are smiling.

A diagram about inclusion. On the left, is a photo of a man looking down while sitting and holding his hands. The photo is enclosed in a green circle. Above him is a hand-drawn illustration of a row of houses and trees. On the right of the diagram is a stat that reads '29%. Over a quarter of people surveyed don't feel part of their local area. Below the stat is a row of four hand-drawn faces. The bigger face on the left is frowning, while the other three faces are smiling.

A diagram of about flexible working. On the left. a stat reads '51%. Half of people surveyed feel flexible working would help them to have a job.' On the right of a state is an illustration of a potted plant and a woman on a phone call while writing with notes on a piece of paper. Both are enclosed in a blue circle. Below the stat are a row of four hand-drawn faces. The two bigger faces on the left are smiling, while the two smaller faces on the right are frowning.

In our research disabled people and people with mental health conditions living in Gloucestershire told us about their experiences:

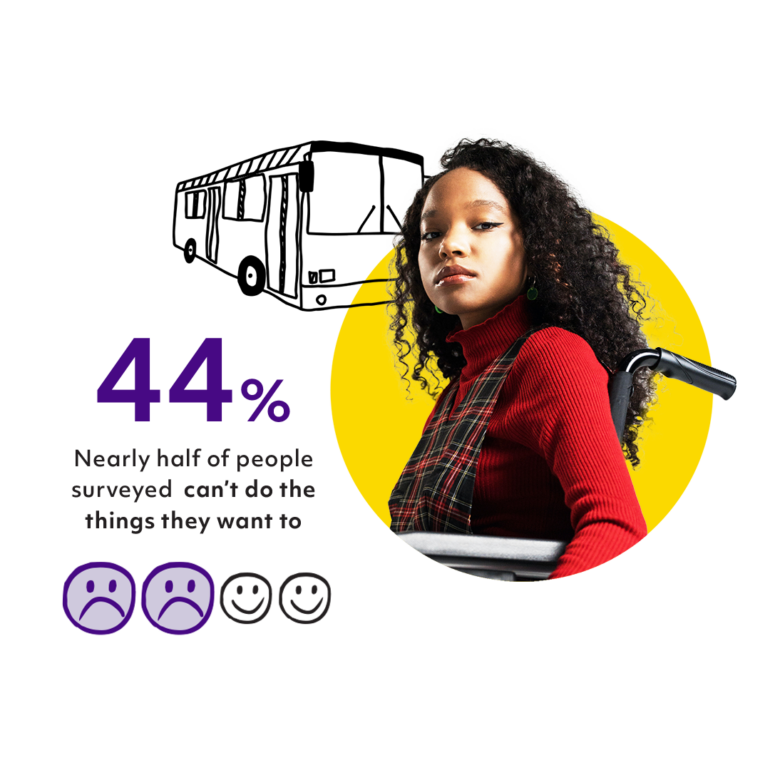
44% Nearly half of people surveyed can’t do the things they want to
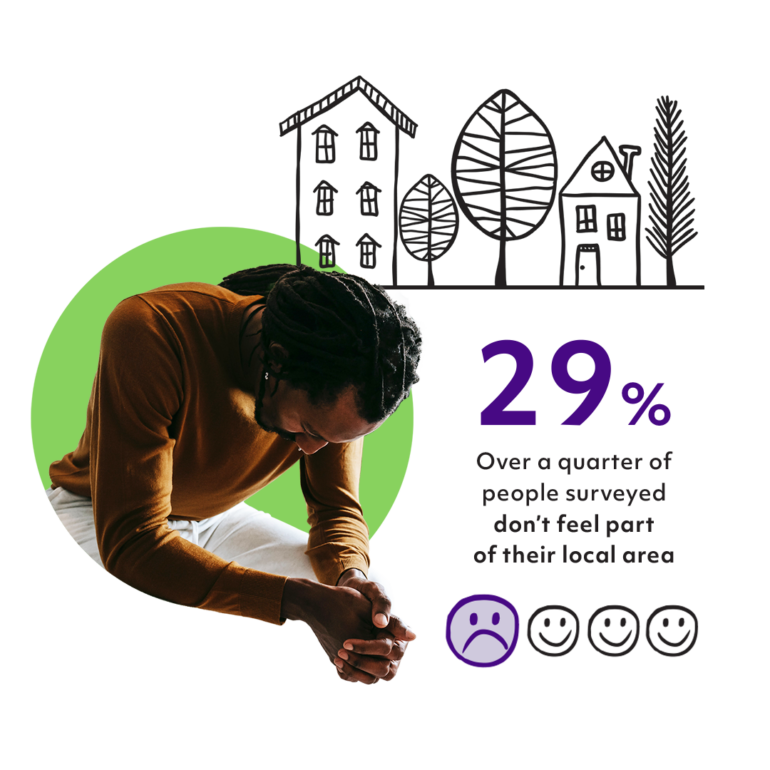
29% Over a quarter of people surveyed don’t feel part of their local area
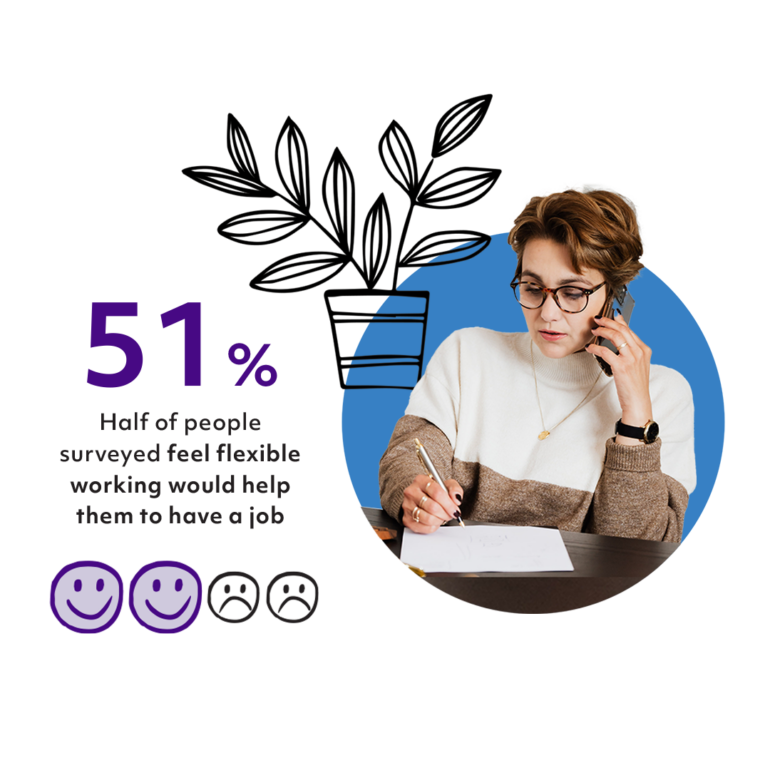
51% Half of people surveyed feel flexible working would help them to have a job